Space Weather Lab
An education-first dashboard for amateur radio operators (UTC time)
Now
Planetary Kp (1-minute)
0
as of 2026-02-04T06:01:00
What does this mean to me?
Kp is a quick “storminess” indicator. Higher Kp often means more fading/flutter and poorer polar paths on HF.
If Kp rises, try non-polar routes and lower bands, and expect aurora potential on VHF.
F10.7 cm Solar Flux
173
as of 2026-02-03T22:00:00
What does this mean to me?
F10.7 is a baseline “how supportive is the ionosphere?” indicator. Higher values usually favor higher HF bands (15m/10m) more often.
It’s not a guarantee—storms and local time still dominate the day-to-day outcome.
NOAA Scales
R0 / S0 / G0
Radio blackouts / Radiation storms / Geomagnetic storms
What does this mean to me?
R events can cause sudden HF absorption on the sunlit side (bands “go dead”).
G events often degrade HF (especially polar) but can enable aurora on 2m/70cm.
Cache generated
2026-02-04T06:06:40+00:00
Auto-refresh every 60 seconds
Space Weather Overview
Live Plots (NOAA/SWPC)
These images are pulled directly from SWPC’s public image products and are useful for quick visual context.
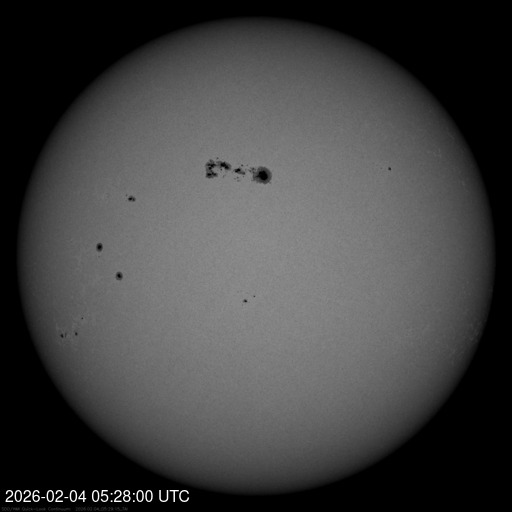
Solar Disk (Sunspots — white light)
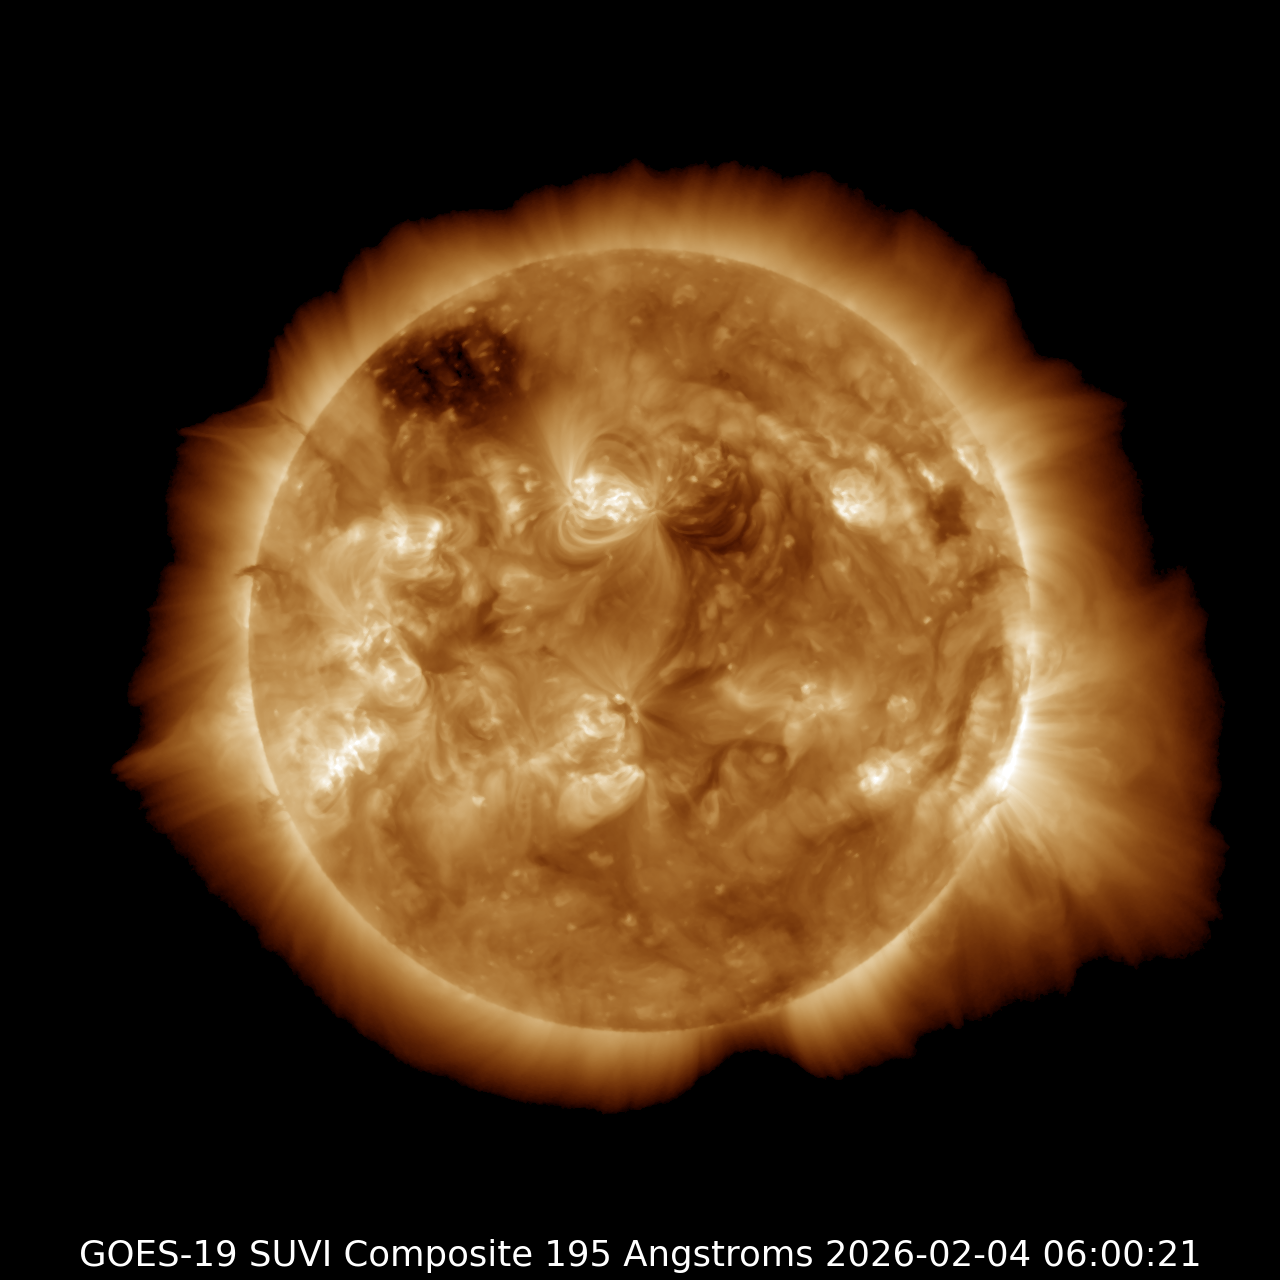
Solar Disk (Active regions — color EUV 195Å)
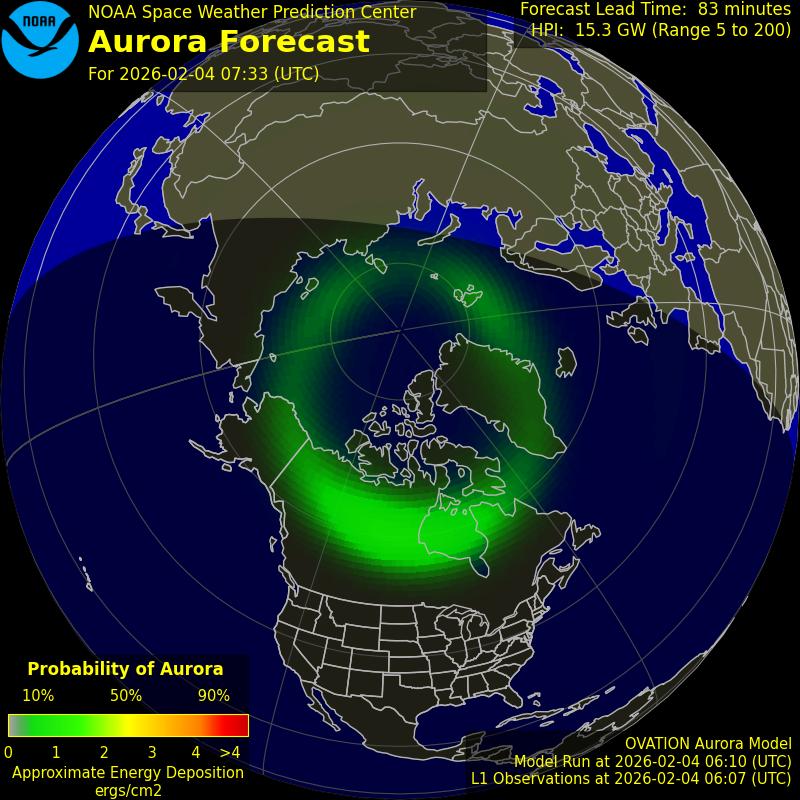
Aurora Forecast (Northern Hemisphere)
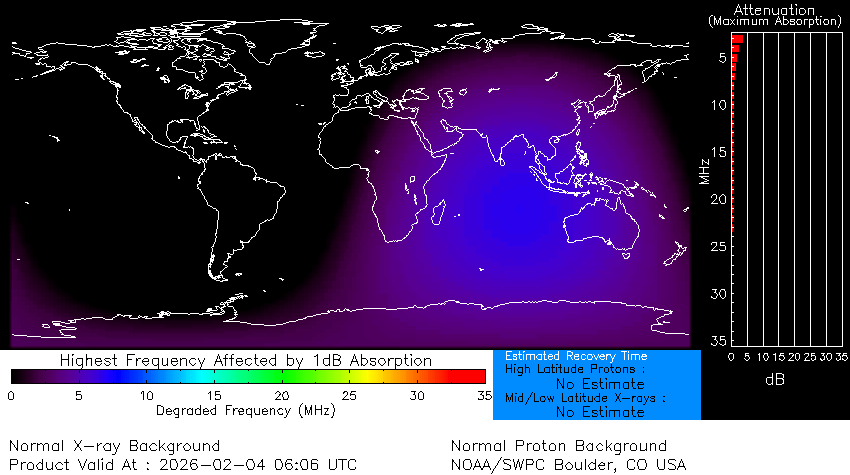
D‑RAP (HF Absorption / D‑Layer)
Real-Time Solar Wind (ACE MAG + SWEPAM)
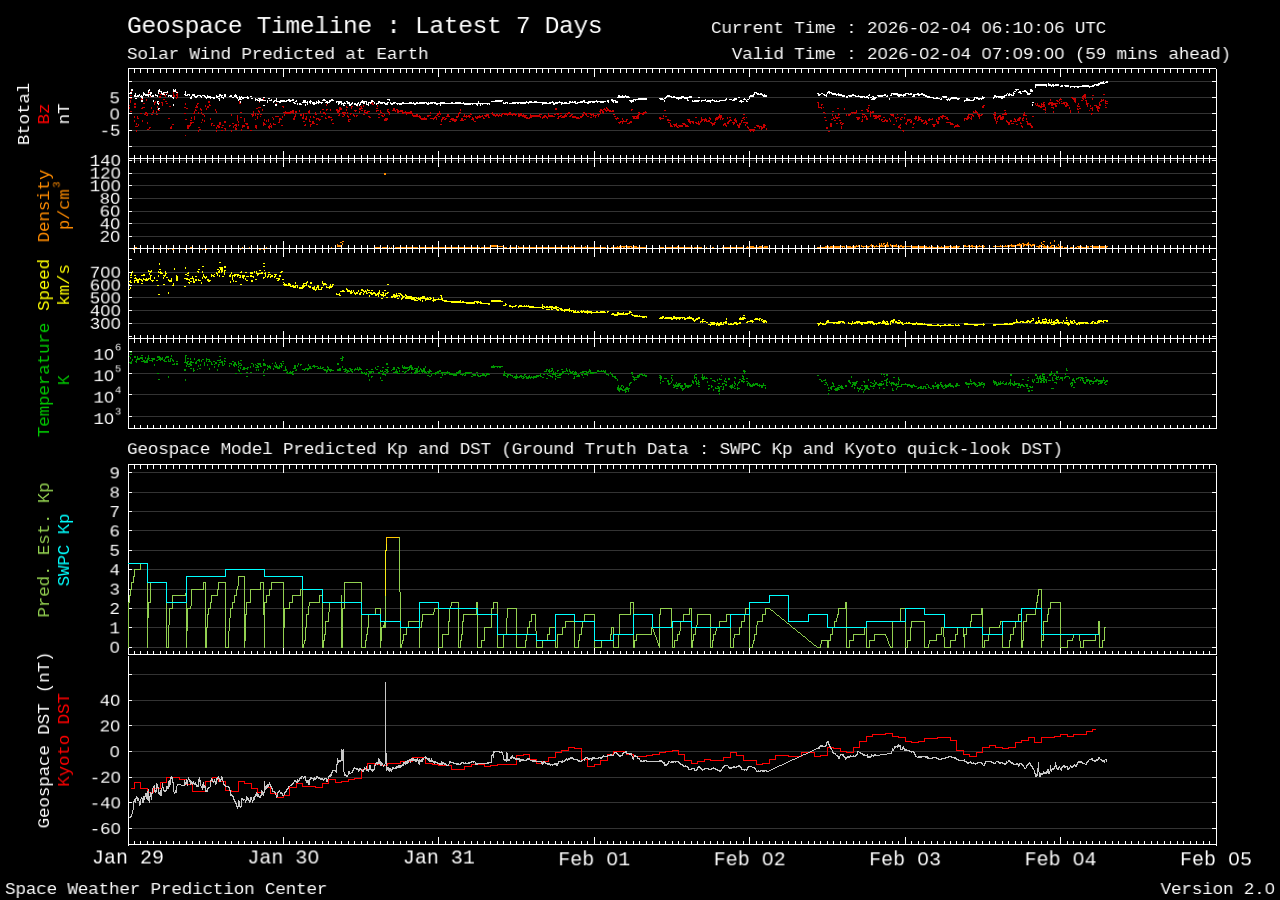
Geospace (7‑Day)
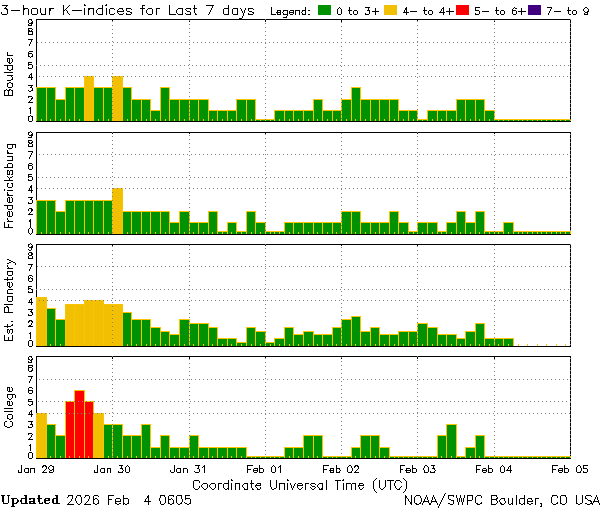
Station K Index
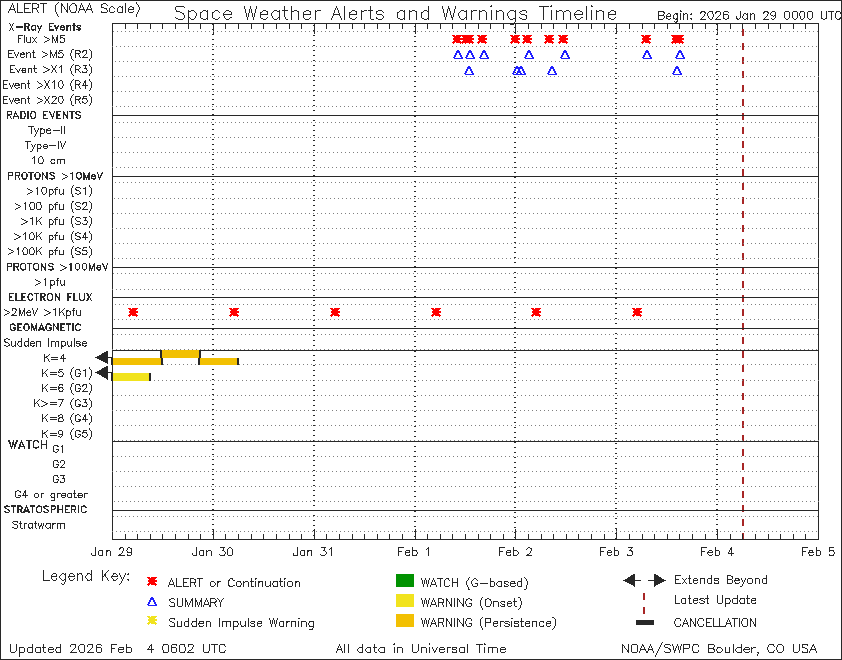
Alerts / Watches / Warnings Timeline
What does this mean to me? (Next 3 days)
Next 3 days (plain-English band outlook):
- Storminess: Kp ≈ 5.0 (stormy). Higher Kp usually degrades polar HF and adds flutter.
- Solar “baseline”: F10.7 ≈ 173.0 (high). Higher tends to help 15m/10m.
- Dayside HF blackout risk (R1–R2): about 80% / 80% / 80% per day (if a flare hits, bands can drop suddenly on the sunlit side).

HF:
- 160m: mostly night-only for distance; daytime often poor due to absorption + noise.
- 80m: best after local sunset through pre-dawn; daytime often limited by D-layer absorption.
- 60m: good for regional/nighttime; usually more stable than 80m in noisier environments.
- 40m: reliable day/night bridge band; expect best DX around grayline and at night.
- 30m: often steady DX when 20m is crowded/unstable; less sensitive to MUF swings.
- 20m: primary DX workhorse; if Kp is unsettled/stormy, avoid polar routes first.
- 17m: similar to 20m but more “selective”; benefits from higher F10.7.
- 15m: good chance of daytime openings.
- 12m: openings likely by day.
- 10m: best high-band: strong daytime potential.

VHF/UHF & satellites:
- 6m: mostly line-of-sight unless there is Es/TEP; space weather matters less than seasonal Es.
- 2m/70cm: normally line-of-sight; if Kp is high, aurora can enable unique paths but may distort signals.
- Satellites: stormy days can increase fades/scintillation (especially on higher frequencies and some geometries).
Show official SWPC 3‑day forecast text
:Product: 3-Day Forecast
:Issued: 2026 Feb 04 0030 UTC
# Prepared by the U.S. Dept. of Commerce, NOAA, Space Weather Prediction Center
#
A. NOAA Geomagnetic Activity Observation and Forecast

The greatest observed 3 hr Kp over the past 24 hours was 2 (below NOAA
Scale levels).
The greatest expected 3 hr Kp for Feb 04-Feb 06 2026 is 5.00 (NOAA Scale
G1).

NOAA Kp index breakdown Feb 04-Feb 06 2026

             Feb 04       Feb 05       Feb 06
00-03UT       1.67         2.00         4.67 (G1)
03-06UT       1.67         2.00         4.00
06-09UT       1.33         1.67         3.67
09-12UT       1.33         1.33         3.67
12-15UT       1.33         1.33         3.67
15-18UT       1.33         3.00         4.00
18-21UT       1.33         4.33         4.00
21-00UT       1.67         5.00 (G1)    4.00

Rationale: G1 (Minor) storming is likely on 05-06 Feb due to the arrival
of the CME associated with the 01/2357 UTC X8.1 flare from Region 4366.

B. NOAA Solar Radiation Activity Observation and Forecast

Solar radiation, as observed by NOAA GOES-18 over the past 24 hours, was
below S-scale storm level thresholds.

Solar Radiation Storm Forecast for Feb 04-Feb 06 2026

              Feb 04  Feb 05  Feb 06
S1 or greater   30%     30%     30%

Rationale: The greater than 10 MeV proton flux has a chance to exceed S1
(Minor) levels over 04-06 Feb due to the high eruptive potential of
Region 4366. The risk of a proton event will increase as the region
moves into a more favorable magnetic connection point in the Suns
western hemisphere.

C. NOAA Radio Blackout Activity and Forecast

Radio blackouts reaching the R3 levels were observed over the past 24
hours. The largest was at Feb 03 2026 1408 UTC.

Radio Blackout Forecast for Feb 04-Feb 06 2026

              Feb 04        Feb 05        Feb 06
R1-R2           80%           80%           80%
R3 or greater   40%           40%           40%

Rationale: Moderate to high solar activity is expected due to M-class
flaring (R1-R2, Minor-Moderate) for the next three days with a high
chance for X-class flares (R3-Strong or greater) due to expected further
activity from AR 4366.
What does this mean to me? (Next 7–10 days)
Next 7–10 days (SWPC 27-day outlook, simplified):
- Day-by-day (UTC): unavailable (SWPC 27-day outlook table not fetched; check Status page / cache warmer).
- These are probabilistic outlooks. Confirm with a quick on-air scan (FT8/WSPR/beacons).
Show official SWPC 27‑day outlook table
:Product: 27-day Space Weather Outlook Table 27DO.txt
:Issued: 2026 Feb 02 0938 UTC
# Prepared by the US Dept. of Commerce, NOAA, Space Weather Prediction Center
# Product description and SWPC contact on the Web
# https://www.swpc.noaa.gov/content/subscription-services
#
#      27-day Space Weather Outlook Table
#                Issued 2026-02-02
#
#   UTC      Radio Flux   Planetary   Largest
#  Date       10.7 cm      A Index    Kp Index
2026 Feb 02     160           5          2
2026 Feb 03     155           5          2
2026 Feb 04     155           5          2
2026 Feb 05     145           5          2
2026 Feb 06     120           8          3
2026 Feb 07     125           8          3
2026 Feb 08     130           8          3
2026 Feb 09     135          10          3
2026 Feb 10     140           8          3
2026 Feb 11     135           8          3
2026 Feb 12     140           5          2
2026 Feb 13     145          20          5
2026 Feb 14     145          15          4
2026 Feb 15     155          15          4
2026 Feb 16     160          15          4
2026 Feb 17     170          15          4
2026 Feb 18     180          15          4
2026 Feb 19     175          15          4
2026 Feb 20     170          15          4
2026 Feb 21     160          15          4
2026 Feb 22     150           8          3
2026 Feb 23     140           8          3
2026 Feb 24     135          20          4
2026 Feb 25     130          20          4
2026 Feb 26     130           8          3
2026 Feb 27     140           5          2
2026 Feb 28     160           5          2
WWV Space Weather Text
:Product: Geophysical Alert Message wwv.txt
:Issued: 2026 Feb 04 0605 UTC
# Prepared by the US Dept. of Commerce, NOAA, Space Weather Prediction Center
#
#          Geophysical Alert Message
#
Solar-terrestrial indices for 03 February follow.
Solar flux 178 and estimated planetary A-index 5.
The estimated planetary K-index at 0600 UTC on 04 February was 0.67.

Space weather for the past 24 hours has been strong.
Radio blackouts reaching the R3 level occurred.

Space weather for the next 24 hours is predicted to be moderate.
Radio blackouts reaching the R2 level are expected.
What does this mean to me?
WWV text is a compact, operator-friendly summary. When it mentions flares, CMEs, or storming, expect rapid changes: verify with an on-air scan.
Band Guidance (heuristic)
This is a lightweight, operator-focused heuristic based on Kp and F10.7. It is not a prediction—validate with on-air checks.
| Band group | Rating | Why |
|---|---|---|
| 10–12–15 m | good | High solar flux with quiet geomagnetic conditions. |
| 17–20 m | good | Mid bands often remain workable unless storms are strong. |
| 30–40 m | good | Often workable; watch storm effects on longer/high-latitude paths. |
| 60–80 m | good | Quiet geomagnetic conditions help stabilize nighttime HF. |
How to use this (quick)
F10.7
Higher often supports higher MUF (better high-band HF), but it’s not the whole story.
Kp
Higher means more geomagnetic disturbance (HF absorption, polar flutter, degraded paths).
R/S/G
Operational “headline” severity levels. Great for fast situational awareness.