Space Weather Lab
Sunspots — what they are, why they matter, and what to do about it
Sunspots are dark regions on the solar photosphere where the magnetic field is unusually strong. They’re not just "interesting astronomy": sunspots mark active regions that can produce solar flares and coronal mass ejections (CMEs), which are the events most likely to disrupt HF propagation.
Right now (ham-relevant quick context)
What does this mean to me?
What does this mean to me?
What does this mean to me?
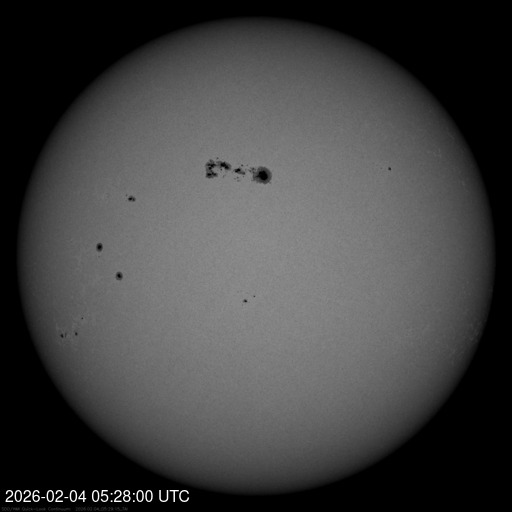
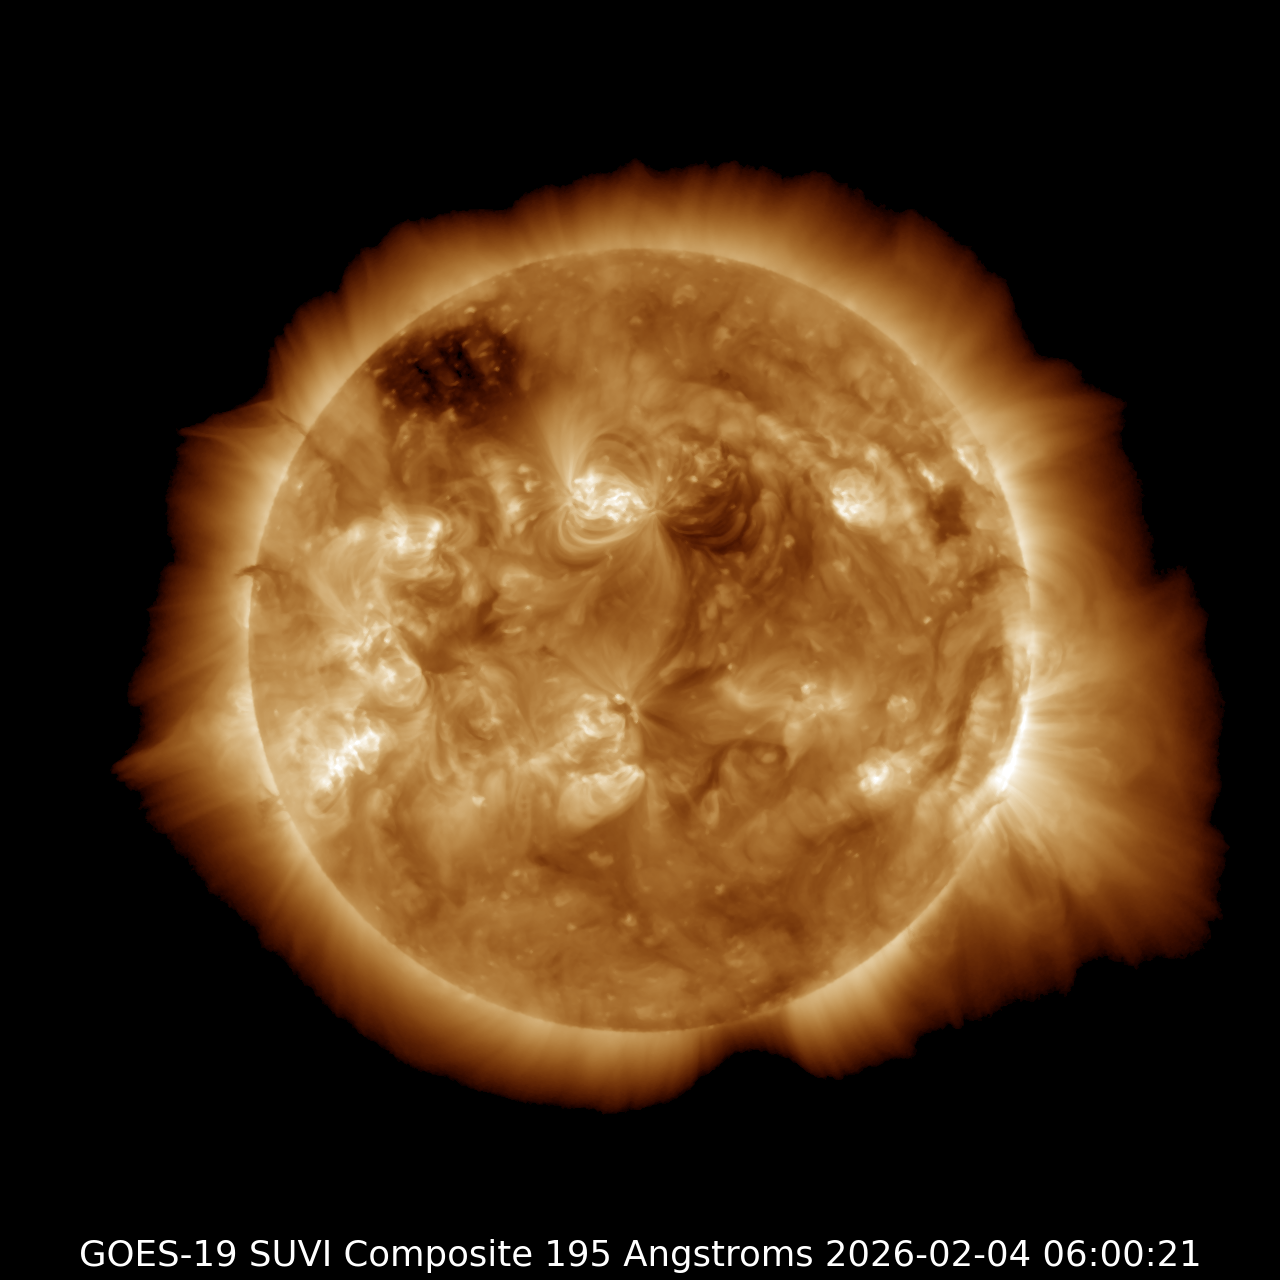
Visual: the Sun right now
These are SWPC-provided "latest" imagery tiles. Click any image to enlarge.
What are sunspots, physically?
A sunspot is a region where magnetic field lines concentrate and inhibit normal convective heat transport. Less heat reaches the surface locally, so the spot looks darker (cooler) compared to surrounding photosphere. Typical spot fields are on the order of thousands of gauss, far stronger than Earth's surface field.
What does this mean to me?
How sunspots form (the short, honest version)
- Solar dynamo: the Sun’s rotating, convecting plasma generates magnetic fields.
- Flux emergence: buoyant magnetic flux tubes rise and pierce the photosphere as bipolar regions (pairs/groups of spots).
- Complexity matters: twisted/sheared fields store free magnetic energy; that energy can be released as flares/CMEs.
A useful operator translation: more/larger/complex spot groups generally imply a higher probability of flare activity.
How sunspots are measured (and what those numbers mean)
- Sunspot Number (SSN): a standardized count-like index used to track solar-cycle activity.
- F10.7 flux: a radio measurement that tracks solar EUV fairly well; often correlates with SSN.
- Active-region classification: systems like Mount Wilson and McIntosh describe magnetic/structural complexity (a flare risk clue).
What does this mean to me?
Active-region classification (McIntosh + Mount Wilson) — a practical operator view
Two widely used descriptors appear in daily region summaries: the Mount Wilson magnetic class (how the polarities are arranged) and the McIntosh class (a compact code describing group structure). You don’t need to memorize every nuance — you just need to recognize when a region is “simple” vs “complex and flare-capable.”
| System | Common Values | Operator Translation | Why You Care |
|---|---|---|---|
| Mount Wilson | Alpha, Beta, Beta-Gamma, Beta-Gamma-Delta | Alpha/Beta = simpler. Beta-Gamma/Delta = more complex, mixed polarities. | More complex magnetic structure generally implies higher probability of M/X flares (R events). |
| McIntosh | 3-character codes (e.g., “Eki”, “Fkc”) | Bigger/more developed groups + compact structure can be more flare-capable. | It’s a quick “shape + complexity” label that helps identify which region(s) to watch. |
What does this mean to me?
The Solar Region Summary table below shows these codes for today’s active regions.
Solar Region Summary (current active regions)
This is the daily SWPC region list: NOAA active-region number, heliographic location, area/extent, and the two “complexity shorthand” codes. If this table is blank, it usually means the server cannot reach SWPC right now (see the Status page).
Issued: 2026 Feb 04 0030 UTC Obs date: 2026 Feb 03
| Region | Location | Area | Extent | McIntosh | Spots | Mag |
|---|---|---|---|---|---|---|
| 4358 | N16W30 | 30 | 4 | CRO | 5 | B |
| 4362 | S16E06 | 40 | 5 | CAO | 7 | BG |
| 4366 | N14E07 | 1100 | 16 | FKC | 42 | BGD |
| 4367 | N09E38 | 50 | 8 | CAO | 10 | B |
| 4368 | S10E38 | 40 | 2 | HSX | 1 | A |
| 4369 | S03E43 | 40 | 2 | HSX | 1 | A |
| 4370 | S18E50 | 30 | 1 | CRO | 1 | B |
| 4371 | S22E60 | 40 | 9 | DAO | 8 | B |
| 4372 | S24W39 | 15 | 4 | BXO | 6 | B |
How do I interpret these codes?
Solar Cycle (predicted smoothed SSN range)
This is a long-term trend indicator (months/years). For day-to-day operations, disturbances dominate.
More detail is in Solar Cycle.
Solar wind: what it is
The solar wind is a continuous outflow of charged particles (mostly protons/electrons) carrying the Sun’s magnetic field (the IMF). When fast streams or CME-driven plasma reach Earth, they can drive geomagnetic storms.
- Bz south (negative): magnetic reconnection becomes efficient → storm potential rises.
- Speed/density up: more energy coupled into Earth’s system.
- Outcome: aurora expansion, polar absorption, HF instability, and sometimes VHF aurora.
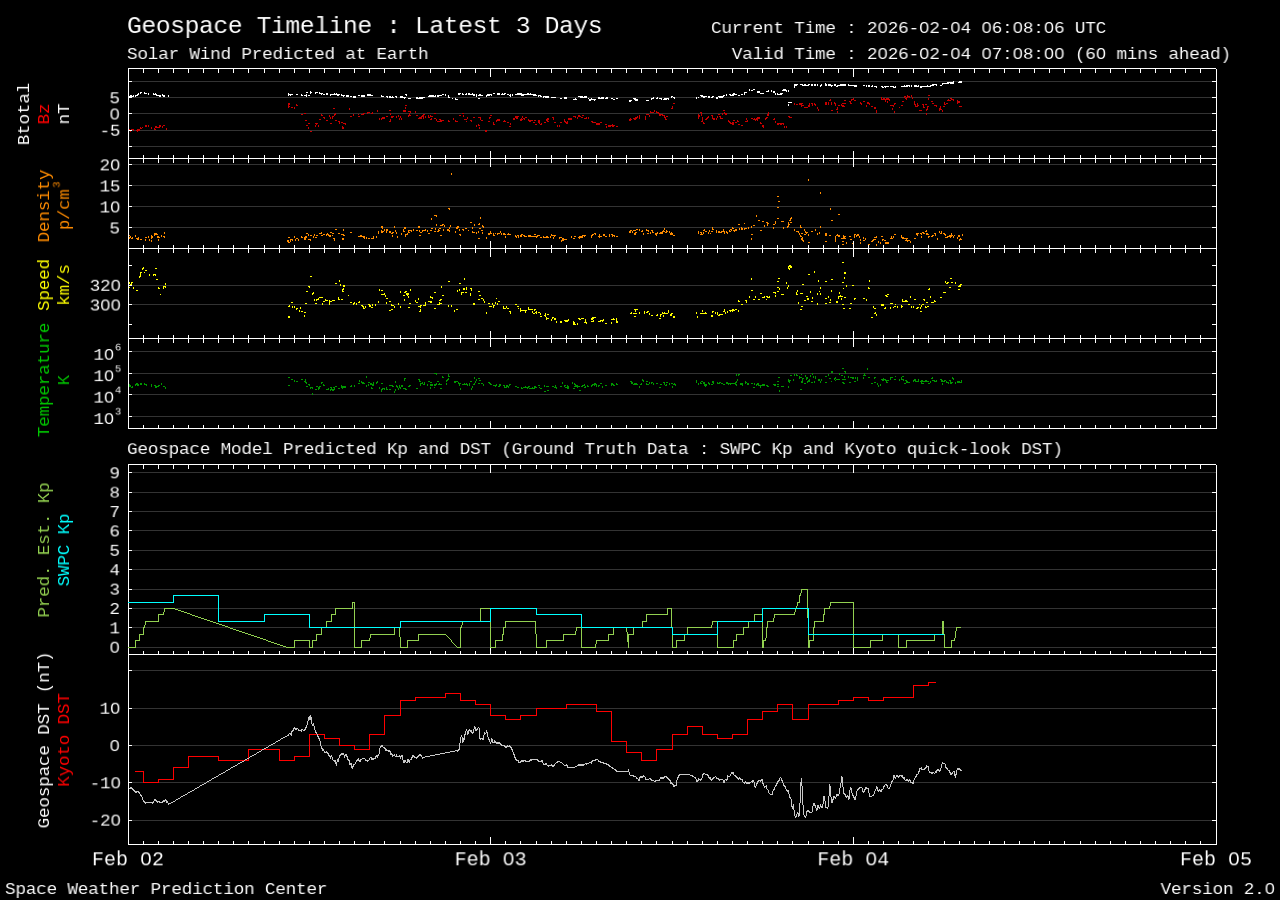
Live context: solar wind & geomagnetic response
On-air impacts: the chain from sunspots → flares/CMEs → ionosphere
- Flares (minutes to hours): increase X‑ray/EUV, boosting D‑region ionization on the dayside → more absorption → sudden HF fadeouts (R events).
- CMEs (1–4 days): disturb Earth’s magnetosphere → geomagnetic storms (G events) → polar HF degradation, fading/flutter, and aurora.
- High baseline activity: often raises MUF (good), but increases the probability of disruptive events (bad).
How to protect your station and electronics
Most station damage risk comes from lightning and power transients. Severe geomagnetic storms can also drive long-conductor currents (grid/pipelines), but at the amateur-station scale your best ROI is disciplined grounding, bonding, and surge control.
- Single-point ground/bonding: bond radio, power supply, coax protectors, and ground bar together to avoid dangerous potential differences.
- Coax surge protection: use quality lightning arrestors and bond them properly; route coax to an entry panel.
- AC surge protection: use whole-house or shack-level surge protection and keep safety grounding intact.
- Unplug when needed: for thunderstorms or severe alerts, physically disconnect antennas and power (no protector is perfect).
- Antenna considerations: avoid long, unbonded control lines; bond towers/masts; keep ground leads short and wide.
What does this mean to me?
SWPC forecast text (for context)
Source: NOAA/SWPC. Interpretation on this site is educational; always cross-check with SWPC directly.
Alerts (recent/active)
- 2026-02-03 16:46:38.020 — Space Weather Message Code: WATA20 Serial Number: 1093 Issue Time: 2026 Feb 03 1646 UTC WATCH: Geomagnetic Storm Category G1 Predicted Highest Storm Level Predicted by Day: Feb 04: None (Below G1) Feb 05: G1 (Minor) Feb 06: G1 (Minor) THIS SUPERSEDES ANY/ALL PRIOR WATCHES IN EFFECT NOAA Space Weather Scale descriptions can be found at www.swpc.noaa.gov/noaa-scales-explanation Potential Impacts: Area of impact primarily poleward of 60 degrees Geomagnetic Latitude. Induced Currents - Weak power grid fluctuations can occur. Spacecraft - Minor impact on satellite operations possible. Aurora - Aurora may be visible at high latitudes, i.e., northern tier of the U.S. such as northern Michigan and Maine.
- 2026-02-03 15:10:43.490 — Space Weather Message Code: SUMXM5 Serial Number: 310 Issue Time: 2026 Feb 03 1510 UTC SUMMARY: X-ray Event exceeded M5 Begin Time: 2026 Feb 03 1445 UTC Maximum Time: 2026 Feb 03 1456 UTC End Time: 2026 Feb 03 1503 UTC X-ray Class: M7.2 Location: N14E14 NOAA Scale: R2 - Moderate NOAA Space Weather Scale descriptions can be found at www.swpc.noaa.gov/noaa-scales-explanation Potential Impacts: Area of impact centered primarily on sub-solar point on the sunlit side of Earth. Radio - Limited blackout of HF (high frequency) radio communication for tens of minutes.
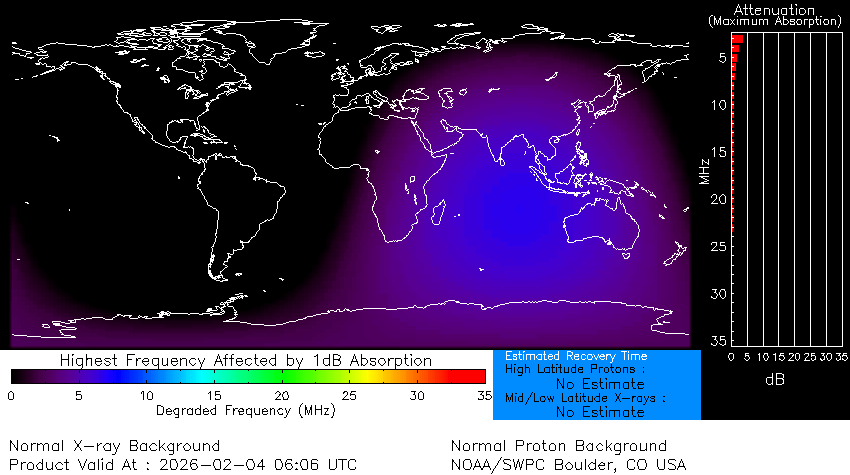
- 2026-02-03 14:58:28.183 — Space Weather Message Code: ALTXMF Serial Number: 519 Issue Time: 2026 Feb 03 1458 UTC ALERT: X-Ray Flux exceeded M5 Threshold Reached: 2026 Feb 03 1455 UTC NOAA Scale: R2 - Moderate NOAA Space Weather Scale descriptions can be found at www.swpc.noaa.gov/noaa-scales-explanation Potential Impacts: Area of impact centered on sub-solar point on the sunlit side of Earth. Extent of blackout of HF (high frequency) radio communication dependent upon current X-ray Flux intensity. For real-time information on affected area and expected duration please see http://www.swpc.noaa.gov/products/d-region-absorption-predictions-d-rap.
- 2026-02-03 14:28:00.830 — Space Weather Message Code: SUMX01 Serial Number: 210 Issue Time: 2026 Feb 03 1428 UTC SUMMARY: X-ray Event exceeded X1 Begin Time: 2026 Feb 03 1358 UTC Maximum Time: 2026 Feb 03 1408 UTC End Time: 2026 Feb 03 1418 UTC X-ray Class: X1.5 Location: N14E14 NOAA Scale: R3 - Strong NOAA Space Weather Scale descriptions can be found at www.swpc.noaa.gov/noaa-scales-explanation Potential Impacts: Area of impact consists of large portions of the sunlit side of Earth, strongest at the sub-solar point. Radio - Wide area blackout of HF (high frequency) radio communication for about an hour.
- 2026-02-03 14:11:30.957 — Space Weather Message Code: ALTXMF Serial Number: 518 Issue Time: 2026 Feb 03 1411 UTC ALERT: X-Ray Flux exceeded M5 Threshold Reached: 2026 Feb 03 1407 UTC NOAA Scale: R2 - Moderate NOAA Space Weather Scale descriptions can be found at www.swpc.noaa.gov/noaa-scales-explanation Potential Impacts: Area of impact centered on sub-solar point on the sunlit side of Earth. Extent of blackout of HF (high frequency) radio communication dependent upon current X-ray Flux intensity. For real-time information on affected area and expected duration please see http://www.swpc.noaa.gov/products/d-region-absorption-predictions-d-rap.
- 2026-02-03 07:25:39.580 — Space Weather Message Code: SUMXM5 Serial Number: 309 Issue Time: 2026 Feb 03 0725 UTC SUMMARY: X-ray Event exceeded M5 Begin Time: 2026 Feb 03 0643 UTC Maximum Time: 2026 Feb 03 0701 UTC End Time: 2026 Feb 03 0719 UTC X-ray Class: M7.2 Location: N14E17 NOAA Scale: R2 - Moderate NOAA Space Weather Scale descriptions can be found at www.swpc.noaa.gov/noaa-scales-explanation Potential Impacts: Area of impact centered primarily on sub-solar point on the sunlit side of Earth. Radio - Limited blackout of HF (high frequency) radio communication for tens of minutes.
- 2026-02-03 07:02:06.397 — Space Weather Message Code: ALTXMF Serial Number: 517 Issue Time: 2026 Feb 03 0702 UTC ALERT: X-Ray Flux exceeded M5 Threshold Reached: 2026 Feb 03 0700 UTC NOAA Scale: R2 - Moderate NOAA Space Weather Scale descriptions can be found at www.swpc.noaa.gov/noaa-scales-explanation Potential Impacts: Area of impact centered on sub-solar point on the sunlit side of Earth. Extent of blackout of HF (high frequency) radio communication dependent upon current X-ray Flux intensity. For real-time information on affected area and expected duration please see http://www.swpc.noaa.gov/products/d-region-absorption-predictions-d-rap.
- 2026-02-03 04:59:47.073 — Space Weather Message Code: ALTEF3 Serial Number: 3619 Issue Time: 2026 Feb 03 0459 UTC CONTINUED ALERT: Electron 2MeV Integral Flux exceeded 1000pfu Continuation of Serial Number: 3618 Begin Time: 2026 Jan 21 0950 UTC Yesterday Maximum 2MeV Flux: 7292 pfu Potential Impacts: Satellite systems may experience significant charging resulting in increased risk to satellite systems.
- 2026-02-02 11:43:12.050 — Space Weather Message Code: SUMXM5 Serial Number: 308 Issue Time: 2026 Feb 02 1143 UTC SUMMARY: X-ray Event exceeded M5 Begin Time: 2026 Feb 02 1115 UTC Maximum Time: 2026 Feb 02 1124 UTC End Time: 2026 Feb 02 1131 UTC X-ray Class: M6.7 Location: N18E30 NOAA Scale: R2 - Moderate NOAA Space Weather Scale descriptions can be found at www.swpc.noaa.gov/noaa-scales-explanation Potential Impacts: Area of impact centered primarily on sub-solar point on the sunlit side of Earth. Radio - Limited blackout of HF (high frequency) radio communication for tens of minutes.
- 2026-02-02 11:23:15.280 — Space Weather Message Code: ALTXMF Serial Number: 516 Issue Time: 2026 Feb 02 1123 UTC ALERT: X-Ray Flux exceeded M5 Threshold Reached: 2026 Feb 02 1121 UTC NOAA Scale: R2 - Moderate NOAA Space Weather Scale descriptions can be found at www.swpc.noaa.gov/noaa-scales-explanation Potential Impacts: Area of impact centered on sub-solar point on the sunlit side of Earth. Extent of blackout of HF (high frequency) radio communication dependent upon current X-ray Flux intensity. For real-time information on affected area and expected duration please see http://www.swpc.noaa.gov/products/d-region-absorption-predictions-d-rap.
Sources (recommended reading)
- NOAA SWPC Products & Data: swpc.noaa.gov/products-and-data
- NOAA Space Weather Scales: swpc.noaa.gov/noaa-scales-explanation
- Solar Cycle Progression: swpc.noaa.gov/products/solar-cycle-progression
- SWPC Solar Region Summary: swpc.noaa.gov/products/solar-region-summary
- Sunspot Number (historical, WDC‑SILSO): sidc.be/SILSO